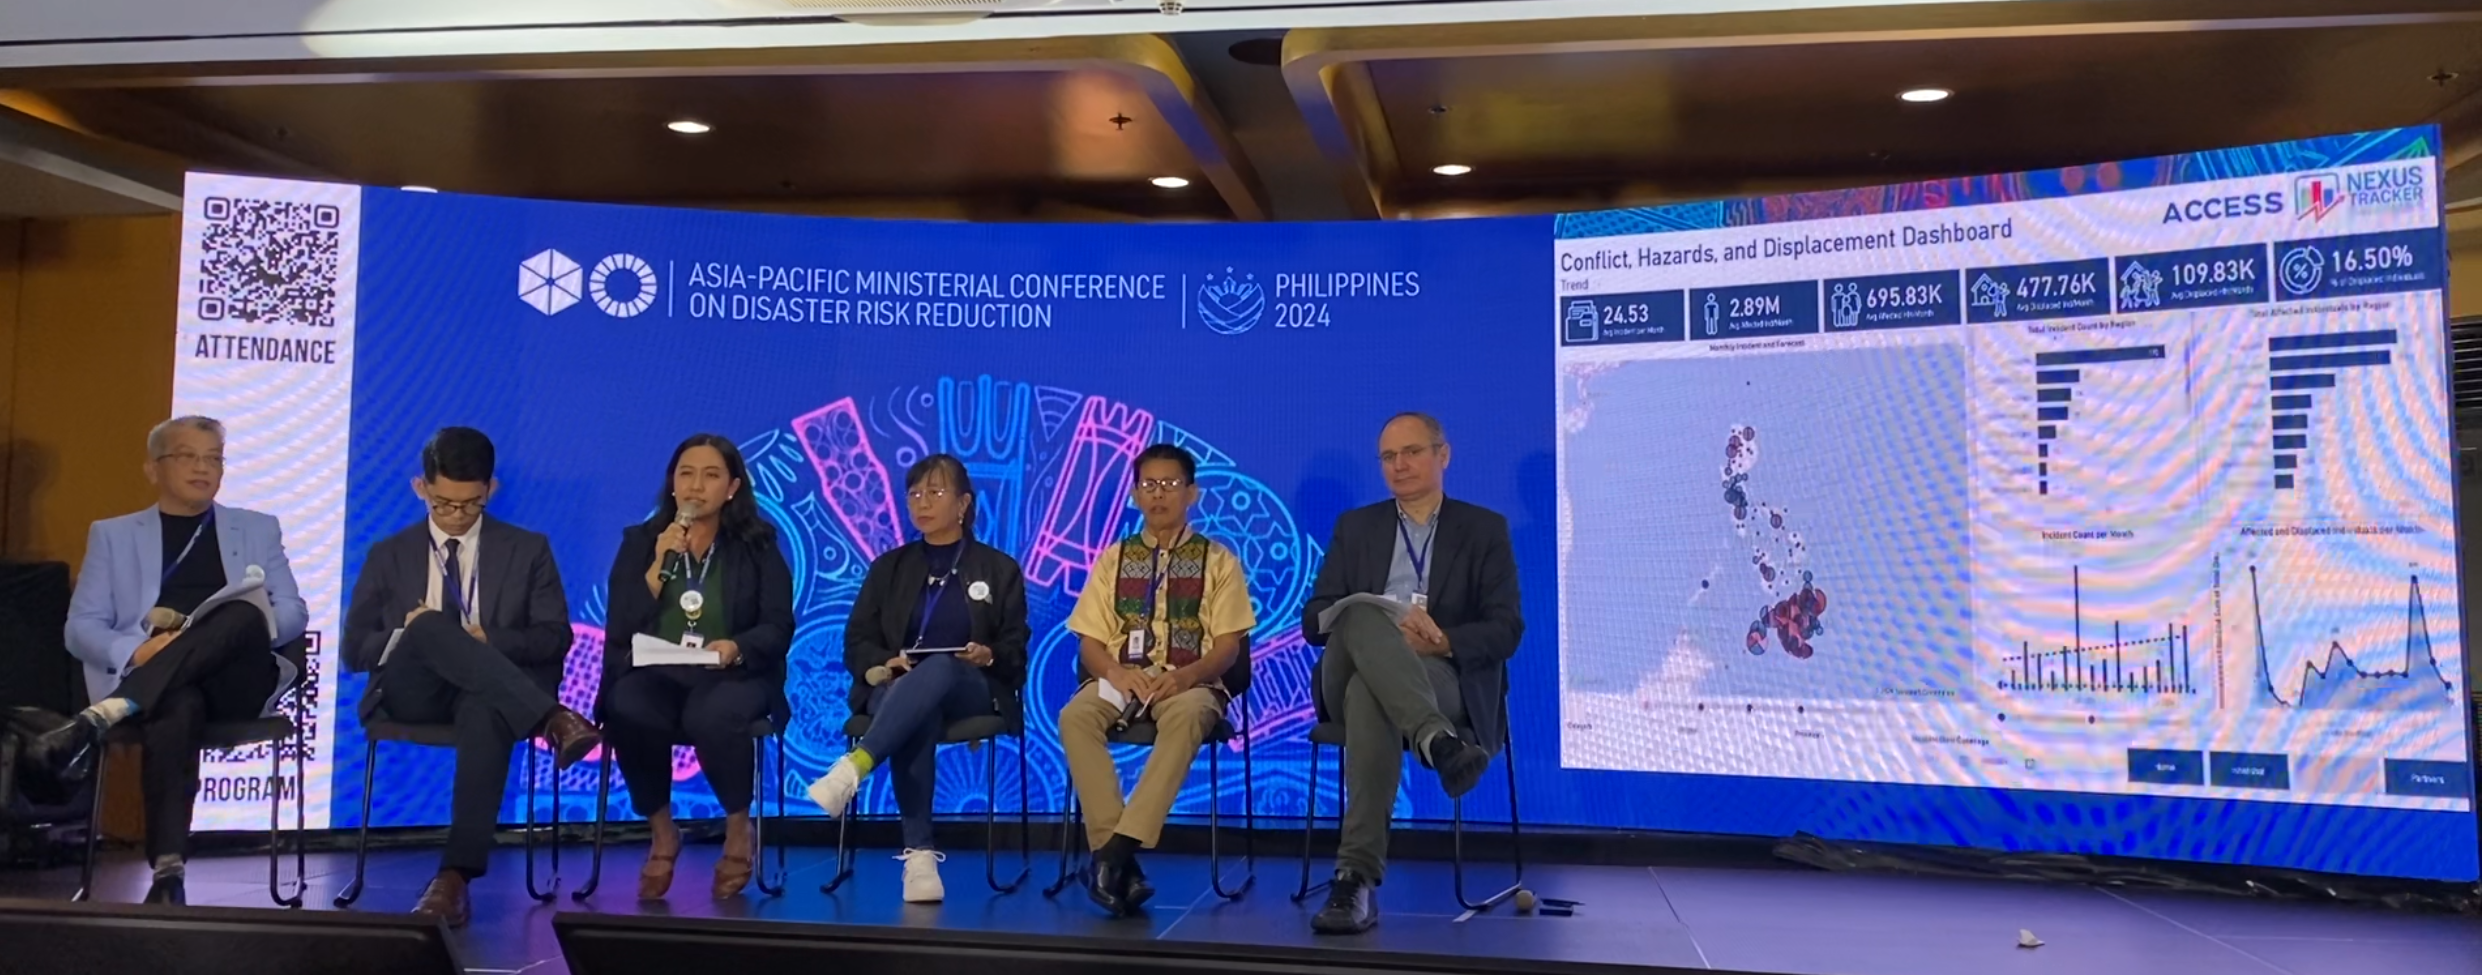
Nexus Tracker (NexT) User Guide: Philippines Disaster and Displacement Data
Welcome to Nexus TrackerThe Nexus Tracker (NexT) is developed by ACCORD for the ACCESS Consortium, aiming to create a comprehensive system for reporting, monitoring, and analyzing hazards, conflicts, and displacement incidents. This tool utilizes data analytics and mapping to provide accurate Philippines Disaster and Displacement Data to support informed decision-making and data-driven programming within the Humanitarian-Development-Peace Nexus.
1. Introduction
Who Can Use This Guide
This guide is designed for the public. It can be used by humanitarian actors, local government units, academe, researchers, and anyone who needs to understand humanitarian trends and make informed decisions using accurate Philippines Disaster and Displacement Data.
- Role: Public Viewer
- Note: All data requests beyond what is visible in the dashboard can be submitted via a Microsoft Forms request form.
Accessing Nexus Tracker
- Access the public dashboard directly via rilhub.org/nexus-tracker.
- Navigate through the dashboard using the available tabs to explore different datasets and insights.
2. Dashboard Overview
The updated Nexus Tracker provides an integrated platform divided into two primary sections, each designed to answer a different set of critical questions regarding Philippines Disaster and Displacement Data. To learn more about global humanitarian standards, you can visit ReliefWeb.
- Gaining Insight (Conflict, Hazards, and Displacement): Answers, “What has happened?”
- Developing Foresight (Potential Impact): Answers, “What might happen?”
From the main landing page, you can select which dashboard you want to view by clicking on the respective buttons. A navigation bar is typically available at the bottom of the dashboard to help you switch between different pages (e.g., Home, Snapshot, Trend, Partners).
Tip: You can expand the view to full-screen mode by clicking the full-screen button (usually at the bottom right of the Power BI interface) for a better viewing experience.
3. Gaining Insight: Conflict, Hazards, and Displacement Dashboard
Core Question: “What is the current and historical situation regarding incidents and displacement?”
This is your primary tool for understanding recorded events. Use it for situational analysis, reporting, and identifying trends. It contains the following main views:
A. Snapshot View: Philippines Disaster and Displacement Data
Think of this as your 30,000-foot view. It provides the most critical numbers for a quick, high-level understanding of the national situation.
- KPI Cards: Headline numbers including Total Incident Count, Affected Individuals/Households, and Displaced Individuals/Households. Use these for quickly pulling key figures for reports.
- Interactive Map: Visualizes the geographic location and concentration of incidents. Hover over a location to see a quick summary.
- Affected/Displaced Individuals by Region: A chart ranking regions by the number of people impacted. Use this to immediately identify the most-affected regions to prioritize attention and resources.
- Provinces with Most Displaced Individuals: A chart pinpointing the exact communities bearing the heaviest burden of displacement.
- Incident Count by Type and Nature: Visual breakdowns of incidents based on their taxonomy (e.g., Conflict vs. Natural Hazards).
- Filters: Use the dropdown slicers for Type, Nature, Region, Province, Month, and Year to focus the entire dashboard on your specific area of interest.
B. Trend View (Discovering Patterns Over Time)
This page helps you see the bigger picture by revealing seasonality, frequency, and long-term changes.
- Incident Mapping: A cluster-based map of incidents to see spatial groupings over time.
- Time-Series Charts (Incidents/Affected per Month): These charts are the core of this page. Use them to identify seasonal patterns (e.g., a spike in flooding in Q4) and track the scale of major events over time.
- Location Breakdowns: Horizontal bar charts allowing for regional comparisons of total incidents and affected populations.
- Incident Date Coverage Filter: A crucial date slicer. Use it to focus your analysis on a specific timeframe, such as “the last 6 months” or “the entirety of 2024”.
Pro Tip: Combine the Date Coverage filter with the Nature filter. For example, select “Tropical Cyclone” and set the date range to the last five years. This will clearly show you the historical cyclone season and its typical impact.
C. Partners View
This page acknowledges the ACCESS Consortium partners and supporting agencies, displaying organizational information for all members of the ACCESS Consortium: Action Against Hunger, ACCORD, CARE, CO-Multiversity, Humanity & Inclusion, IMAN, Kadtabanga, MOSEP Inc., OXFAM Pilipinas, PDRRN, PLAN Pilipinas, Save the Children, UNYPAD, and UnYPHil-Women./p>
4. Developing Foresight: Potential Impact Dashboard
Core Question: “A hazard is coming. What will the humanitarian impact be?”
This is a specialized forecasting tool for anticipatory action. It uses demographic and vulnerability data to estimate the impact of incoming hazards, supporting pre-disaster assessments and impact-based forecasting.
A. Tropical Cyclones View
- TCWS Selector & Map: Allows you to select areas under specific Tropical Cyclone Wind Signals (TCWS) and view an impact map highlighting those regions.
- Potentially Affected KPIs: Estimates the population and households at risk.
- Potentially Displaced HH: Estimates households at risk due to weak shelter materials. Use this for pre-positioning shelter repair kits.
- People in Need: Estimates the number of people living in poverty in the storm’s path, helping anticipate the need for food aid and essential services.
- Affected Drinking Water Sources: Estimates the number of households with possibly affected water sources.
- Individuals with Functional Difficulties: A critical number for planning an inclusive response.
B. Earthquakes View
- Vulnerability Map & Magnitude Filter: Assesses vulnerability and potential impact from seismic events based on selected magnitude levels (e.g., Magnitude 6 or above).
- Detailed Data Table (WGQ Data): A granular table showing population, households, poverty incidence, and specific vulnerability markers. This powerful table breaks down the population with functional difficulties by type, age, and sex.
Pro Tip: Use the WGQ Data Table for detailed inclusive response planning. For example, a high number of individuals with “Walking or climbing steps” difficulty suggests a need for accessible evacuation centers and transportation.
5. General Tips & Best Practices
- The Filter Funnel: Always start with a broad view (no filters), then apply filters one by one to narrow your focus. This prevents you from getting lost in the data.
- Reset, Reset, Reset: Before starting a new analysis, always clear your previous selections using the “Clear Filters” button. A forgotten filter is the most common source of confusion.
- Hover for Details: Move your mouse over almost any chart element (a bar, a map bubble, a pie slice) to see a tooltip with precise numbers and extra information.
- Cross-Page Analysis: Use the pages together. If you see a spike in the Trend view, use the Snapshot view filters for that month to understand the specific incidents that caused it.
6. Exporting and Requesting Data
Users can request detailed datasets through the Nexus Tracker Data Request form. If you require raw data exports not currently available in the views, please submit a request through the official channels.
7. Feedback and Support
- For questions about the data or feedback on the dashboard, please contact: nexustracker@accord.org.ph
- For technical issues (e.g., dashboard loading errors or broken links), please contact the technical support team via the provided email.
ANNEX A: Data Definitions for Incident Categorization
To ensure consistent analysis and reporting, all incidents in the Nexus Tracker are classified using a two-level system: Nature (the broad category) and Type (the specific event). Understanding these categories is key to using the dashboard’s filters effectively.
- Conflict Horizontal Refers to conflicts between non-state actors, such as families, clans, communities, or private armed groups (e.g., Rido, Crime and Violence, Politics-related).
- Conflict Vertical Refers to armed confrontations involving state security forces (e.g., AFP/PNP vs NPA, MILF, ASG, BIFF).
- Natural Hazards Events caused by natural processes that negatively impact communities (e.g., Tropical Cyclone, Flooding, Earthquake, Drought).
- Other Human-induced Hazards Hazards caused by human action, negligence, or error (e.g., Fire, Oil Spill, Industrial Accidents).
Using these categories to filter the dashboard will allow for a more precise and insightful analysis of the humanitarian situation.